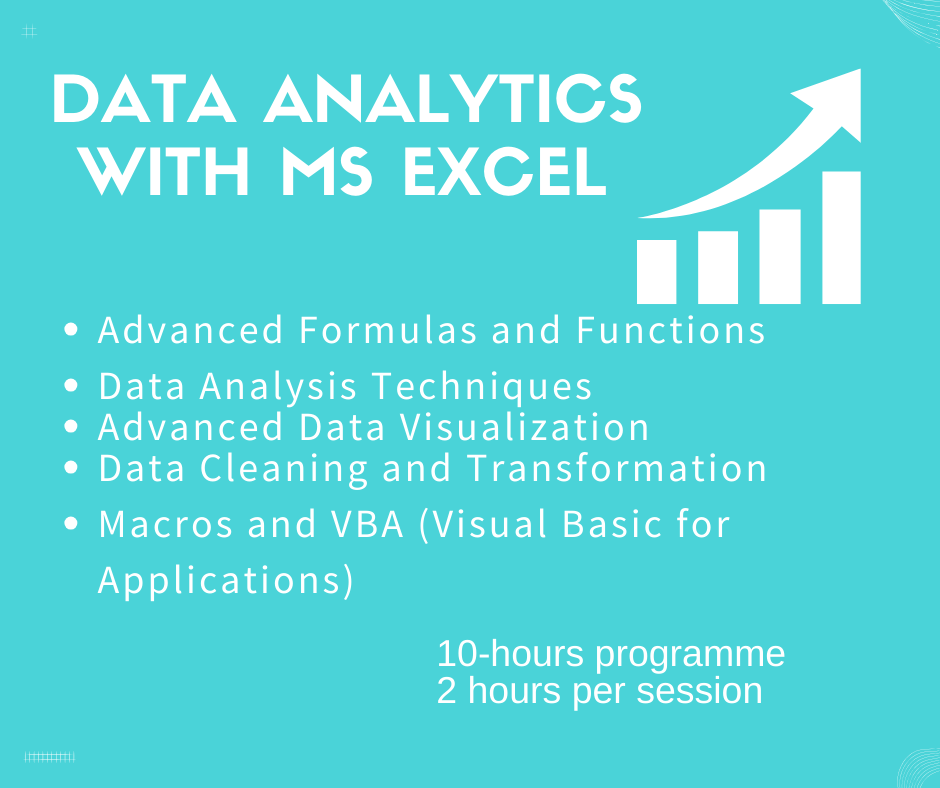
5-Weeks Crash Course on Data Analytics with MS Excel
Data Analytics Using Microsoft Excel
This comprehensive five-session course is designed to equip with essential skills in data analytics using Microsoft Excel. Starting with an introduction to the fundamental concepts of data analytics, you will progress through hands-on sessions covering Excel basics, data importation and cleaning, exploration and visualization techniques, and advanced Excel functions for data analysis.
Participants will delve into the power of Excel PivotTables for data summarization, learn to create and customize various charts for effective data representation, and explore advanced functions like VLOOKUP, HLOOKUP, and statistical functions for in-depth analysis. The course will also introduce to Excel Solver for optimization problems and Power Query for efficient data manipulation and integration.
Session 1: Introduction to Data Analytics and Excel Basics
Objective:
Introduce the concept of data analytics.
Familiarize with basic Excel functions and features.
Agenda:
- Introduction to Data Analytics
- Overview of Microsoft Excel
- Data Import and Cleaning
Definition and importance
Applications in various industries
Excel interface and navigation
Basic spreadsheet operations (entering data, formatting, etc.)
Cell referencing and formulas
Importing data into Excel
Cleaning and formatting data
Handling missing values
Session 2: Data Exploration and Visualization
Objective:
Teach how to explore and visualize data using Excel tools.
Agenda:
- Exploring Data
- Introduction to PivotTables
- Data Visualization
Sorting and filtering data
Using Excel tables
Creating PivotTables for data summarization
PivotTable analysis and customization
Creating basic charts (bar charts, line charts, etc.)
Customizing charts for better representation
Session 3: Advanced Excel Functions for Analytics
Objective:
Introduce to advanced Excel functions for data analysis.
Agenda:
- Advanced Formulas
- Date and Time Functions
- Statistical Functions
IF statements and logical functions
VLOOKUP and HLOOKUP functions
SUMIF and COUNTIF functions
Working with dates and times in Excel
Date and time calculations
Introduction to statistical functions (AVERAGE, STDEV, etc.)
Applying statistical functions to analyze data
Session 4: Data Analysis with Excel Solver and Power Query
Objective:
Introduce to advanced data analysis tools in Excel.
Agenda:
- Excel Solver
- Introduction to Power Query
- Combining Data from Multiple Sources
Introduction to optimization problems
Setting up and solving optimization problems using Solver
Connecting to external data sources
Transforming and cleaning data with Power Query
Merging and appending data tables
Data consolidation techniques
Session 5: Case Studies and Real-world Applications
Objective:
Apply learned skills to real-world scenarios.
Provide hands-on experience with practical case studies.
Agenda:
- Case Study Analysis
- Group Project
- Q&A and Next Steps
Present real-world data scenarios
Guide through the process of solving using Excel analytics
Participants work on a group project applying learned skills
Present and discuss findings
Answer participant questions
Provide resources for further learning

